![]()
Denis Wood is an independent scholar with a PhD in geography from Clark University. He’s the author of a dozen books and over 150 papers. From 1974 to 1996 he taught in the School of Design at North Carolina State University. In 2008 the University of Chicago Press published The Natures of Maps, co-authored with John Fels; in 2010 Guilford published Rethinking the Power of Maps. Since then, Siglio has published his neighborhood atlas, Everything Sings, maps from which have been exhibited internationally. His book, Weaponizing Maps, co-authored with Joe Bryan, is due out later this year.
Katy?
by Denis Wood
published November 2014
Editor's note: This introduction to Issue 6: Cartography and Narratives links the two journals that jointly published on this topic: The Cartographic Journal and NANO: New American Notes Online.
Katy?(1)
Katy and the Big Snow? Could that have been where I first saw a map? Maybe. Could have been. Pretty close anyway. I certainly can’t think of any I saw before it. Katy came out in 1943, a couple of years before I was born.(2) My mother read it to me when I was very young. She read it to me and Chris and Pete, my brothers. Other people read it to us too, our grandmothers, pre-school teachers. It was pretty popular. But it was easy to look at even without being able to read. It was easy to follow make and sense of.
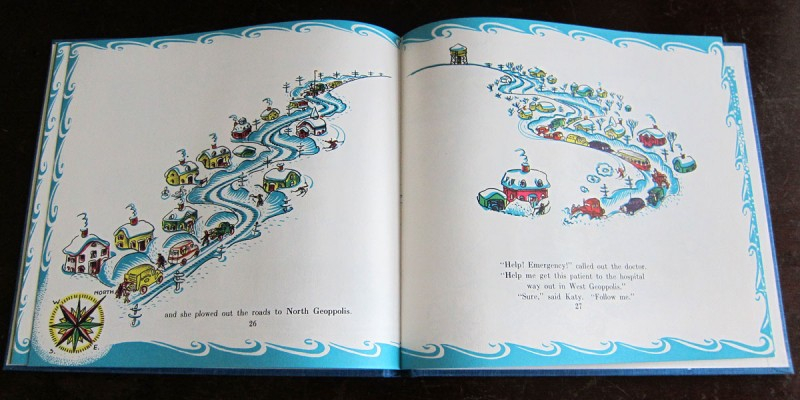
Katy’s a tractor attached to the Highway Department of the City of Geoppolis. In the summer she’s a bulldozer, but in the winter she’s a snowplow. Virginia Lee Burton, Katy’s author, explain Katy’s duties in a glorious two-page “Map of City of Geoppolis,” wreathed with keyed vignettes of city departments and schools, the train station and the airport. It’s a bird’s-eye view, and there Geoppolis is, spread out like a particularly delicious-looking pastry. Then a blizzard buries it all and Katy slowly digs it out again. We watch her plowing out the city hall and the fire department and the doctor’s office and finally the runways of the airport. That is, we watch as Katy redraws the map of Geoppolis for us. In time. As a story.
This is to say that my very first map came with its redrawing in time and as the action in a story. Wow!
Around about then I also read Isobel Harris’ Little Boy Brown with its illustrations by the great André François. This came out in 1949, when I was four, and I’ll bet my parents bought it for me right off.(3) Little boy Brown was only four-and-a-half years old, so we would have been age mates, though little boy Brown lived with his parents in a hotel in Manhattan, while I lived in a housing-project apartment in Cleveland. To get to work, little boy Brown’s parents took the elevator to a tunnel that took them to the subway and then to their offices, which they similarly reached through tunnels and elevators. They never had to go outdoors at all. The drawing of the father going to work shows him high in the elevator shaft, halfway down, just above the subway, and rising to his office in three similar steps. That is, he appears six times, in six different places, in the same drawing.
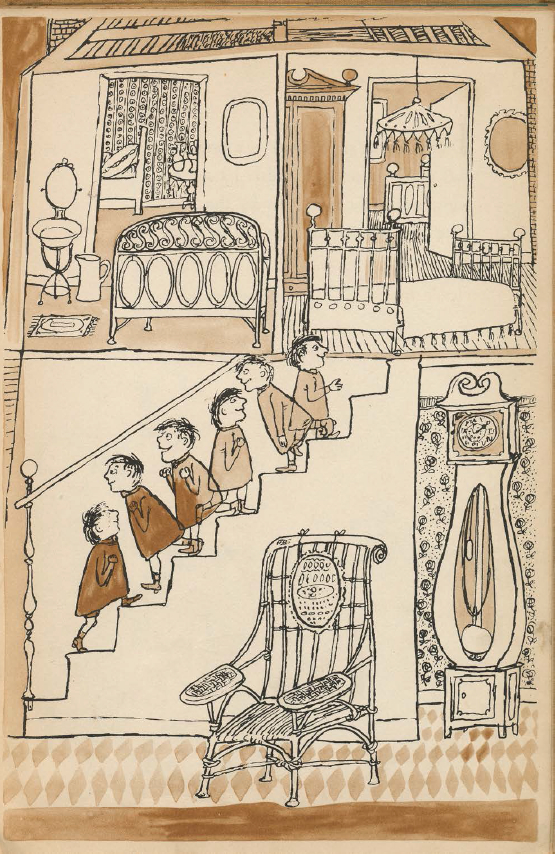
Little boy Brown does go outside, and one day Hilda, a chambermaid, takes him out to her house out in the country: “Hilda’s house is wonderful! It has upstairs for bedrooms and downstairs for the kitchen and living-room. There is no elevator, only stairs to walk up and down. I walked up and down eleven times.” François’ illustration has three little boy Browns going downstairs, and three going up: six little boy Browns!
How long did I look at these drawings? I don’t know, but I loved them; and here I am looking at them again, sixty-five years later, in the same copy of the book I had as a kid.
So by the time I was four, I knew that maps were made in time – that they contained passed time – and that you could capture the passage of time in a single drawing. I’m not sure what I mean by “knew” here, but in time I did come to understand what all this meant: what it meant and what it meant in a world where most of what I would come to be taught in the following years kept space and time in separate boxes, in different subjects, often in different buildings, geometry and geography in their places, physics and history in theirs. Space and time were different things, very different things.
And English, where narrative lodged, that was somewhere else altogether!
But I never forgot what I’d learned from Burton and François. There were a lot of other maps, maps that I took much more seriously – those in The Hobbit, for instance, and Big Tiger and Christian (4)–but in fact I returned to Burton and François often enough that it was no surprise to find myself, in geography at Clark, saying in my master’s thesis that: “Time is a vital component of our lives, and too little work has been done on the relations between time and space that is lived by humans. This might be said to have top priority.” I called the thesis Fleeting Glimpses – it’s about the mental images of their town held by (mostly) adolescents living in San Cristobal las Casas – and thus I worked into its title a temporal term; but, focused on the spatiality of the “mental maps” I’d collected, I failed to much explore their temporal dimension or to discuss the temporal data that I’d gathered, about sounds at different times of day and week (and year), about smells, about colors.(5) But the issue was clearly on my mind.
Enriched with a deepening understanding of relativity theory, in my dissertation I decided to trash both time and space and replace them with spacetime events, events that were separated by intervals.(6) The events in my case were the behaviors of the kids I was studying, American teenagers on their first trip to Europe, events I was trying to get a handle on through the trace events the kids left behind in the maps they made for me. It immediately became obvious to me that all maps were trace events. I observed that maps were made in time (the protocol that the kids followed for drawing their maps embedded the order of their construction in the maps); and that maps were made at a time (and here again the kids made maps of a given environment over time, one after another); and that, as traces of spacetime events (the psychophysical events that resulted in the lines on the paper), the maps could be arbitrarily analyzed into spatial or temporal dimensions. I did both. Analyzed as space the maps were images of cities; analyzed as time the maps were narratives about the kids’ experiences. Taken together the maps comprised stories about the kids in London, Rome, and Paris.(7)
Just as Virginia Lee Burton’s did about Katy plowing snow in Geoppolis. Somehow I’d managed to come home.
But every map is like this. Every map encapsulates a story about its creation and a story it wants to tell about what it thinks it’s about. Penobscot names, for example (in the paper here by Margaret Pearce) or the localized journey the two-year-old, James Bulger, was taken on to his death (in the paper by Les Roberts), just as every map embodies the time when it was made (like these by Pearce and Roberts now that the possibilities for making them have opened). Thinking about maps this way led me and the landscape architecture students I taught at the School of Design at North Carolina State to treat the maps of local neighborhoods we began making in 1975 as narratives, and about a semester’s worth of maps as a narrative atlas. In 1982 we put together Dancing and Singing: A Narrative Atlas of Boylan Heights (finally published, with its space-time images, in 2010 as Everything Sings: Maps for a Narrative Atlas(8)); and in 1987 I read “Pleasure in the Idea: The Atlas as Narrative Form” at a conference on school atlases (narrative atlases are the subject of Bieke Cattoor and Chris Perkins’ paper here, and narrativity is an important concept for most of the contributors to this issue of NANO: New American Notes Online).(9) The narrative atlas that my students and I had made had been designed for distribution in the neighborhood that it was about as a kind of intervention, and during the following decade I pushed this idea into that of every map as a sign system intended to influence others in a communication situation. This acknowledged the map’s social dynamism as well as its temporality so that by the time the “spatial turn” had begun to spin the cages of the humanities, I had pretty much abandoned the idea of the map as something peculiarly spatial.(10)
In fact the idea of the map I carried around in my head from 1992 on was that of “a more or less permanent, more or less graphic object supporting the descriptive function in human discourse that links things through territory by fusing onto a common plane (that of the map) multicoded images of the very world the map itself brings into being. Due to this, maps become weapons in the fight for social dominion, weapons disguised as representations of the world.”(11) Note not only the absence of the word “space” here but the absence of any reference to wayfinding, and a countervailing emphasis on the map as a weapon. In fact, given the minor role maps have played in wayfinding (until very recently) its importance in the stories people tell about maps is all out of proportion. At their hearts maps are really about control, control of territory. That’s what their stories are mostly about–“You own that piece of property,” they say, or “You live under these sets of laws”–and if their success at this has fostered their spread into a zillion other functions, everyone of them is subsidiary.
To a large degree, then, what I think of as a map excludes many of the subjects of the papers gathered in NANO–most of the art that Aileen Harvey is concerned with, for example; the film Hiroshima mon amour, that Jytte Holmqvist writes about; the war letters that are the subject of Christina Knopf’s paper; Laurene Vaughan’s video; and Francesca Rendle-Short’s construction of her father–not only because balls of plasticine, movies, letters home, videos, and photographs aren’t maps, but because none of them is much into control either. Or for that matter into any of the other things maps are conventionally supposed to be about. Rendle-Short’s “Poetic Cartography, Love and Loss” is exemplary. A writer of essays, memoir, and fiction, Rendle-Short here presents us with an essay exploring–slippery idea–“poetic cartography,” but about the death of her father. She includes an inventory of his last room and six captioned photos she took of him with her phone. “I have written about my father before,” she notes, and indeed she has–it’s a project–as she has about her mother. She links together memoir, poetry, and cartography, but the last as a metaphor for…knowing the relationships of things? She wants to compose cartography, but in writing. In the end, I come to share her anguish–if that’s right–in her father’s death and his strong creationism, but cartography seems to be her way of suggesting…knowledge.
And of course mapmaking is a way of knowing…
Laurene Vaughan’s piece, “A Contemplative Atlas of Transition,” is just as oblique. An associate professor of Design and Communication at Melbourne’s RMIT University, her interests revolve around practice, design, making, and place, where place here constitutes the connection to, well, what Vaughan calls “vernacular cartography.” Here the body is a mapping tool “that both records space and through its actions or practices makes place.” In the atlas at hand, the “stationary cartographic practice” is sitting and looking, and its heart is a “digital video compilation and contemplation on the world that is made through looking.” This is a collage of up to six video images that play at the same time, images and sounds variously overlapping. As she says, “This project raises questions of what defines a map or an atlas,” though for Vaughan the answer would seem to revolve around…place?
Indeed, can you map anything else?
The piece by Holmqvist about Alain Resnais’ film, Hiroshima mon amour, takes a related tack across evidently roiled waters. Accepting Resnais’ “screened urban space” as an “emotive map,” one that contrasts and reconciles the Hiroshima of 1945 (what Homqvist refers to as “Resnais’ archival cinematic map”) with that of 1957, Holmqvist then uses the map to plot the relationship of Resnais’ two lovers, a Japanese architect and a French actress. The result is a “map of love” (what Giuliana Bruno construes as the “body-city on a tender map”(12)), across which Holmqvist tracks Resnais’ dance of the present and the past, forgetting and remembering, trauma and healing. A PhD candidate at the University of Melbourne, Holmqvist has written extensively about film, often with an emphasis on their spatial character, but her use of map has more to do with relationships.
Relationships, of course, are what maps are made of.
Christina Knopf, an associate professor of communication at SUNY-Potsdam, is interested in the way war letters can act as spatial artifacts, artifacts that, thanks to deictic shifting, can enable their recipients to share the spaces, the places, of the soldiers writing the letters. Knopf is first of all concerned with the features of spatial reference that the soldiers exploit, but then with the emotional resonances these evoke; and she sees the writer as a mapmaker, and his or her respondent as a map-reader, a map reader “who creates new maps in the process.” In the latter role, Knopf has created a bird’s-eye view and a map from letters sent by soldiers from Korea and Iraq.
But then maps are nothing but networks of deictic reference…
Irene Kopelman, Roni Horn, Gabriel Orozco, Francis Alÿs, Richard Long, and Helen Mirra are the artists that English artist, Aileen Harvey, writes about in “Walking, drawing, indexing: representing bodily experience of landscape,” a title that pretty well sums up her interest in these artists and their connection to mapping, mapmaking, cartography. Kopelman’s and Horn’s drawings, Orozco’s plasticine ball, Alÿs’ knots, Long’s walks, and Mirra’s prints are all indices of things these artists have done with their bodies and, Harvey writes, “In relating a human body's trajectory to an environment, they are cartographical. If an artwork could be used to recapitulate a pathway through the world, it is in some sense a map.” As she goes on, “Works that represent indexically can also function as narratives, as recounted sequences of events,” so the works here are both maps and stories. I myself have written about Alÿs and Long as map artists–though in relation to work using maps or exploiting them(13)–but here the connection is entirely metaphorical…
As though maps weren’t already metaphors themselves!
So: knowledge, place, relationships, deictic reference, metaphor: these capture a big chunk of the human enterprise, don’t they? Other papers hew little closer to the cartographic norm. Maryclare Foá’s drawings, for instance, though traced from photographs taken by Commander Chris Hadfield from the International Space Station, are…drawings. An artist and associate lecturer at the University of the Arts in London, Foá is interested in the way organisms and environments interact, shape, influence—the way they make each other. She’s done a lot of work with sound–pioneered driftsinging–and on a YouTube video accompanying her paper she sings along with the drawings she’s made from his photographs. (She calls this a “vocal scat improvisation titled ‘Hum for Hadfield’.”) Less concerned than the others with nailing a connection to maps, to cartography, Foá uses neither word in her piece which seems to be really about…seeing. [Editor's note: Foá’s article has been retracted.]
As Kate McLean’s seems to be about … smelling: “My work draws from contemporary cartographic theory and sensory ethnography to develop tools for analyzing sensory ethnographic findings; visual and linguistic descriptors for an odour classification system; and to contribute to debates on promoting memorable urban tourism where tourists fulfill multiple roles as authors, consumers, and producers of the smellscape.” McLean, a UK designer, photographer, and teacher–and the creator of half a dozen smell maps–used bottled smells, Post-It notes, and actual maps to construct the smell map of Paris she writes about here. From the 532 notes she collected, McLean constructed a virtual dérive to “conjure engagement with the smells of a journey through the use of cartography as a structure for a collective narrative full of emotionally charged personal mini-narratives of place.” Whew!
It sounds almost as exhausting as the physical dérives pursued by Matthew Bissen in “Walking the Everyday,” especially since he’s tweeting as he walks. Mapping the walks and tweets together lets Bissen produce what he calls narrative cartographies through which he imagines the construction of a more connected, more interconnected city. An architect, instructor at Parsons, and a PhD student in geography at CUNY, Bissen exploits his dérives to help construct a city: “A walk is only one transect through this environment, but the fact that it can be real-time published allows others to be in contact with this enunciation of space as it becomes the milieu of the city. These moments and positions are now known and connected to multiple actors, thus reducing barriers to enable new ways to contact others.”
There’s a sense in which this could be thought of as a kind of “open work,” and this is the concept around which the last two papers in NANO wrap themselves. Drawing on Umberto Eco’s The Open Work, Kate Church, a lecturer in the School of Architecture and Design at RMIT (where she’s also a PhD candidate), pursues the 1934 Melbourne flood of the Yarra River through a gaggle of statistics; an alter-ego, April Thrippingston Baker; the Yarra River itself; the manmade, flood-control island initially called Como (which was swept away in the 1934 flood) and then, rebuilt, to be known as Herring; a collection of maps; drawings; text; all…“to be continued.” Construing the naming of April Thrippingston Baker as “almost a cartographic act, enabling an entity, previously vague and formless to assume an identity,” Church also maps Herring Island (in a variety of ways) and the lost, and/or hidden, tributaries of the Yarra, giving them, as well, locations “in a larger system of meaning.” This whole ensemble map-narrates the flood in an open, encyclopedic fashion.
Lisa Diedrich, Gini Lee, and Ellen Braae (all involved with landscape on the faculties of the Swedish University of Agricultural Sciences, the University of Melbourne, and the University of Copenhagen respectively) deal with the question of open work via the transareal approach pioneered by Alexander von Humboldt, especially as transmitted through the work of the contemporary Humboldt scholar, Ottmar Ette. “A transareal approach,” they’ve written, “embraces mobility across geographical borders and territories alongside open-ended thought across scientific, cartographic and cultural disciplines,” and here they apply this to a transect across the Canary Islands, retracing that of Humboldt across Tenerife, projecting it across the islands he didn’t visit, and leaving themselves open to every manner of serendipitous invitation and divagation. The result is an elaborately annotated…cartographic diary.
There are actual maps in Bissen’s, McLean’s, Church’s, and Diedrich et al.’s papers–and I guess a couple in Knopf’s–but the rest are map free; yet I couldn’t be more excited to find them–all of them–accepted as responses to a call for papers on cartography and narrative. After all, at the end of Rethinking the Power of Maps I wondered, “What if we started multiplying the numbers of maps beyond anything we’ve seen so far? Not just counter-maps– not when we’ve just seen the way a state like Israel can fashion itself entirely out of counter-maps–and not just map art–which is better but in the bitter end just another kind of commerce–but, I don’t know, guerilla maps, crazy maps, subterfuge maps, hurrah-for-anything maps, lunatic maps, maps like whirling snowflakes…and they were everywhere, contradicting, undermining, denying, proclaiming, confusing…until maps became a kind of babbling and people stopped paying any attention to them? Could we…could we dissolve the maps of states in them? Could we…dissolve the state?”(14)
I mean, using map, using cartography, the way these authors do–invariably nailing “in some sense” (as they say) one core concept or another–has precisely the effect I was hoping for, that of flattening, spreading out, smearing not only the words themselves but the concepts classically attached to them, concepts ultimately focused on the control of territory. And, wonderful to say, the papers appearing in The Cartographic Journal follow suit, and this despite the fact that they’re uniformly concerned with, and reproduce, what anyone might call a map…if with a difference. Roberts’ paper about the 1993 murder of James Bulger is illustrative. Here Roberts, who lectures in communication and media at the University of Liverpool, retraces with a video camera the walk Bulger’s murderers took him on, from the shopping center where they abducted him, to the railway tracks where they killed him. Roberts sees this and the events that followed (and continue to follow) as containing “cartographies of memory and trauma,” if … cartographies in the mode of what David Turnbull and Tim Ingold think about as mapping (that is wayfinding), as opposed to what they characterize as mapmaking (that is cartography); which is to say, “knowledge as the product of embodied spatial practices” as opposed to “the abstract uniformity of fixed spaces of representation.” It was his interest in the former that led Roberts into cinemapping as a way of coming to grips with the local of the events, accepting Tom Conley’s notion that “films are maps insofar as each medium can be defined as a form of what cartographers call ‘locational media’.” The aim of Roberts’ film, then, was to “explore and ‘map’ cartographies of knowledge that are ambulatory: the product of embedded and embodied spatial engagement.” By posting the film on YouTube, Roberts’ was further able to tap into the rich veins of commentary that YouTube accretes and so to flesh out the place of the local in a story which had become increasingly emblematic. That is, although his paper is littered with maps, here the actual map is a video.
What the actual map is in Pearce’s paper is less easy to say. Although there are eight maps of Penobscot place names in the paper–the first half of which is about making these maps–ultimately Pearce realized “that the place names could not be separated from the larger framework of Penobscot traditional cartography. Indeed, the belief that they could be represented separately was the very moment at which their meanings drained away.” In her paper Pearce reviews how she came to realize this “as a result of a cartographic design process transformed by narrativity and Indigenous protocols,” and ultimately how both the form and content of the map shifted as a result, transforming a “map of oddly scattered place-name clusters” into “a continuous framework of lines and names,” once, that is to say, that Pearce grasped the fact that the place names were routes embedded in stories. In the second half of her paper, Pearce embeds the Penobscot tradition of story-place name-travel route-travel in a traversal of related Indigenous practices elsewhere. What emerges is a way of thinking about place much more akin to Roberts’ cinemapping than to the mapmaking carried out in capitalist economies worldwide for the past five hundred years (that is, in Japan, China, Europe, and elsewhere).
It is on precisely these economies that Cattoor and Perkins focus in a bright and prescient analysis of five narrative atlases–made by architects–concerned with the Chicago street grid, the Mississippi Delta, western US mining sites, Hong Kong’s vertical transportation network, and a stretch of Belgian highway. Cattoor, a PhD student at the University of Leuven, and Perkins, a senior lecturer at the University of Manchester, trace the atlases’ narrative power to their focus on relationsbetween different layers, scales, or temporal elements in a landscape; and, in ways both novel and powerful, to their “projective imagining of possible futures though the analysis of existing forms.” Following their provocative introduction, Cattoor and Perkins examine each of the five atlases in ways sufficiently inviting that I found myself ordering copies of all of them, including Cattoor and Bruno De Meulder’s brilliant Figures Infrastructures, an analysis of the roads and railways between Courtrai and Ghent from multiple perspectives over time. Here at last were maps exploited in all their narrative potential! Yet even the “simple” guide to Hong Kong’s system of vertical connectivity had, beyond its massive ingenuity, sufficient invitation to the imagination to justify its claims to narrativity. All the atlases did. Powerfully!
Anne-Kathrin Weber-Reuschel flips this coin by presenting a dynamic model for mapping narratives. That is, it’s narratives that are being mapped here, not rivers or cities. Weber-Reuschel is part of a group working on the Literary Atlas of Europe at the Institute of Cartography and Geoinformation (of the Swiss Federal Institute of Technology Zurich). This group hopes to put online an interactive atlas that could be used in the spatial analysis of literature. Here, Weber-Reuschel is proposing a way to present, in a single map, the varying densities of data–sites, addresses, place names–that inevitably arise in a literary work (or works), by running the literary information collected in the atlas’ databases through the diffusion algorithm developed by Michael Gastner and Mark Newman for producing density equalizing maps. What this produces are maps whose scale varies with the density of the data, thus letting you see everything, but in the context of the broader region. Insets have historically addressed this problem, but Weber-Reuschel’s solution is not only coherent, it’s elegant. After all, it’s the focal attention of the narrative that drives the scale changes!(15)
Just as it was the narrative that pushed François to put six little boy Browns on the stairs at Hilda’s house. I mean, what is this but the illustrative equivalent of the Gastner and Newman algorithm? Just as Burton’s focus on each of the buildings Katy plows the snow to get to…blows up, exaggerates them—each of these moments–all of which together are caught up on, all of which together come to compose the map of the city plowed. The map contains all these events, all this passed time, sucks it up, inhales it…to comprise the narrative display that it is.
And every map does this.
Nice of the authors of these papers to draw our attention, in all their various ways, to this fact!
Notes:
1. This linking essay has been published simultaneously in The Cartographic Journal and in NANO: New American Notes Online
2. Burton, Virginia Lee. Katy and the Big Snow (Boston: Houghton Mifflin, 1943). See also the sixth chapter of Elleman, Barbara. Virginia Lee Burton: A Life in Art. (Boston: Houghton Mifflin, 2002). I find Burton’s books as stimulating today as I did as a kid.
3. Harris, Isobel. Illustrations, François, André. Little Boy Brown. New York: Lippincott, 1949. The book was reissued just last year by Enchanted Lion Books in Brooklyn.
4. I wrote about my discovery of Tolkien, J. R. R. The Hobbit (Boston: Houghton Mifflin, 1937), in a paper, “Track of the A.B. and Boy in Fog: Arthur Ransome’s Maps for Swallows and Amazons,” forthcoming in English Language Notes. I wrote about the map in Muhlenweg, Fritz. In geheimer Mission durch die Wüste Gobi (Freiburg: Herder, 1950); and Muhlenweg, Fritz. Big Tiger and Christian. (New York: Pantheon, 1952), in Wood, Denis. “Humanization of Cartography.” Bulletin of the Geography and Map Division of the Special Libraries Association 91 (March 1973): 2-10, and Wood, Denis. “Children’s Books Aren’t Just for Kids.” Bulletin of the Geography and Map Division of the Special Libraries Association 104 (June 1976): 17-26.
5. This was published as Wood, Denis. Fleeting Glimpses, or Adolescent and Other Images of the Entity Called San Cristobal Casas (Worcester, MA: Clark University Cartographic Laboratory, 1971) 237.
6. This was published as Wood, Denis. I Don't Want To, But I Will (Worcester, MA: Clark University Cartographic Laboratory, 1973). The discussion of space and time is on pages 13-17 and 76 and chapter 13 (346-370), but elsewhere as well since it affects the analyses performed on the trace events.
7. See especially, Wood, Denis and Robert Beck. “Janine Eber Maps London: Individual Dimensions of Cognitive Imagery.” Journal of Environmental Psychology, 9.1 (1989): 1-26.
8. The long history of this publication is recounted in Wood, Denis. Everything Sings (Los Angeles: Siglio P, 2010); and 2nd edition, 2013: 149 (in the second edition).
9. This was published as Wood, Denis. “Pleasure In the Idea: The Atlas As a Narrative Form.” Cartographica 24.1 (1987): 24-45, with other conference papers.
10. Denis Wood, The Power of Maps (New York: Guilford Press, 1992), which sums up my thinking of maps to that point.
11. I came to this understanding through the process of writing The Power of Maps. I first articulated it more or less this way in the lecture that inaugurated the Power of Maps exhibition, published as Wood, Denis. “How Maps Work.” Cartographica 29.3&4 (1992): 66-74.
12. This is from Bruno Giuliana, Atlas of Emotion: Journeys in Art, Architecture and Film (New York: Verso, 2002) 242, but Holmqvist actually quotes this herself.
13. See chapter seven, Denis Wood, Rethinking the Power of Maps (New York: Guilford P, 2010).
14. Rethinking the Power of Maps, 254.
15. Because of conflicting deadlines it was not possible to mention the paper by Ralph K. Straumann, Arzu Çöltekin, and Gennady Andrienko which appears in the special issue of The Cartographic Journal and the article by Dominic Redfern’s “Zanci Station: Exploded Diagram,” which appears in NANO: New American Notes Online.